")
Quota attainment is not the end all be all when it comes to measuring sales representative performance. Over analyzing all the data we can collect is also inefficient and useless. We need to find the happy medium – the key sales performance metrics that we can calculate quickly without over doing it. These are the 6 you need.
In baseball, there is the batting average, on base percentage, slugging percentage, HRs, ERA, WHIP, RBI’s and a whole gang of other stuff. In football, there is completion percentage, TD’s, YAC (yards after the catch), QBR (Quarterback Rating), yards per carry, yards per game and more. In basketball, there is field goal percentage, blocked shots, steals, free throw percentage, points per game, efficiency and, as with the other two, a whole slew of other individual stats.
As we’ve seen, with the increased interest in Moneyball and sabermetrics, sports has become an accountants world, accounting for the good and the bad of every at bat, every throw, every steal, every missed basket, every carry, shot taken, and more. The effectiveness and efficiency of every player is counted, manipulated and evaluated like the balance sheet of a Fortune 100 company. It’s the ultimate in individual accountability and player evaluation.
Players go from team to team, year after year with their stats following them around like an albatross or a medal of honor. All culminating in the end their careers with lifetime stats; a lifetime .320 hitter, a career scoring average of 27 points per game, 755 HRs, 2000 yard season etc. As much as team sports is about the team, the accounting of individual accomplishments is as much about the game as is wins and losses.
Unfortunately sales seems to view things differently. We don’t track much more than quota attainment. An arbitrary metric where the industry’s best can find themselves rising above or falling below through no fault of their own. Beyond the quota attainment, sales does little to track, measure and embrace the statistical nuances of selling.
Like sports, there are a number of stats that can tell us a great deal about the selling prowess of our sales reps, that is if we chose to measure them.
Sales organizations could benefit tremendously from individual stats. It would give them the ability to measure their athletes, cause let’s admit that’s what they are, on more than just quota attainment, but on their entire body of work.
Determining what to measure isn’t a daunting task. We don’t need a plethora of complex, confusing and superfluous stats. We just need a few key sales performance metrics that tell the bigger story:
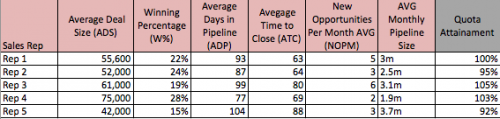
Average Deal Size: How good is the sales rep at up selling? How quickly do they discount deals? How strong of a negotiator are they? Average deal size provides insight into how well a sales rep can maintain the integrity of pricing and drive greater value into the sale.
Winning Percentage: What percentage of opportunities does the sales rep close? How effective are they with the opportunities they get. A higher winning percentage suggests an impressive ability to qualify or add substantial value to the sale. High winning percentages means less leads and opportunities wasted.
Average Days in Pipeline: Take all the opportunities in the pipeline and add up the number of days they have been in the pipeline, then divide by the number of opportunities. How long do deals sit in the pipeline? How good is the sales rep at knowing when to stop working a deal and close it? Is their pipeline stuffed with “stuff” that just isn’t going to close? Is there a decent ratio between average days in pipeline and average time to close? There should be.
Want Sales Tips Straight to Your Inbox Every Sunday? Join Our Newsletter!
Average Time to Close: How long does it take for a sales rep to close a deal from start to finish? Who on your team closes deals faster? Who takes longer? How do average time to close rates compare with quota attainment and overall revenue attainment. Are those with longer sales cycles selling more? Or are those with faster close rates selling more. Average time to close includes both wins AND losses. It’s designed to measure the amount of time it takes a sales rep to bring a buyer to the decision.
New Opportunities per Month (NOP): Who is best at building their pipeline? Which reps are focused on new opportunities vs. closing existing opportunities. How many new opportunities are your sales people putting into the pipeline each month? NOP is a critical metric few pay attention to. Knowing who is bringing in the opportunities is critical.
Average Monthly Pipeline Size: What does the pipeline look like from month to month. Who is good at being able to keep it consistent, vs those who see big shifts as they close, then prospect, then close. AMPS allows you to see who is capable of maintaining a strong pipeline while closing deals and driving revenue.
Measuring sales reps around these individual statistics and sales performance metrics requires nothing more than a commitment, a commitment to track them, share them and rank the team against them. The information generated around these 6 stats will change the sales game. Good reps will be found even in bad years, bad reps will no longer be able to hide. One hit wonders, like those in the majors, will not be able to bask in the glory of a lucky kill. Management will have more information to work with; trends will be easier to spot and opportunities will present themselves.
It’s time we start measuring sales people on more than just quota attainment. It’s time we start looking at the entire body of work and accurately assessing our reps on these sales performance metrics. I can imagine a future where we are proud to say I have a lifetime winning percentage of 34%. Now that’s just cool.
What would your stats say about you?
If you or your organization need help improving your sales performance metrics, click here to schedule a call with our sales team.


0 Comments