2014 SaaS Survey Delivers Industry Benchmarks
October 9, 2014
David Skok, of Matrix Partners, has teamed up again this year with Pacific Crest, an investment banking firm with a specific focus on SaaS, to survey 306 SaaS companies. Our Market Insights team also lent support and therefore we are proud to present some of the survey results below.
The survey covers a variety of financial and operating metrics pertinent to the management and performance of SaaS companies, ranging from revenues, growth and cost structure, to distribution strategy, customer acquisition costs, renewal rates and churn. Out of this survey comes benchmarking data and insights we believe can help all those working in SaaS to build stronger companies. For full results and to sign up to receive or participate in the survey next year please visit David Skok’s blog – ForEnterpreneurs.
About the Survey Participants
A larger, more diverse group of SaaS companies participated this year:
- $4MM median revenues, but nearly 50 companies with >$25MM and 80 with <$1MM
- 46 median full-time employees
- 284 median customers, with 25% having >1K customers
- $21K median annual contract value (ACV), with 30% below $5K and 20% above $100K
- Good mix of sales channels including field sales, inside sales and mixed distribution models
- Participation from around the world, though primarily U.S.
2014 SURVEY RESULTS
How Fast Did / Will You Grow GAAP Revenues?
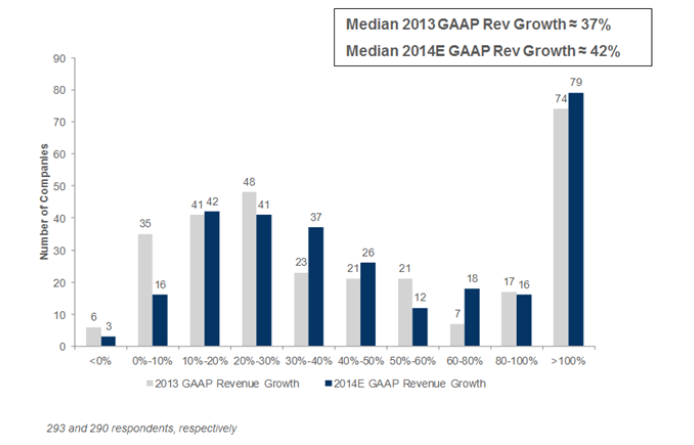
Historical rates for the group were 37% for 2013, while the median projected growth for 2014 is 42%. These rates remain very healthy, but both are lower than the 2013 survey’s results of 41% and 47% for 2012 historical growth and 2013 estimated growth.
How Fast Did / Will You Grow GAAP Revenues?
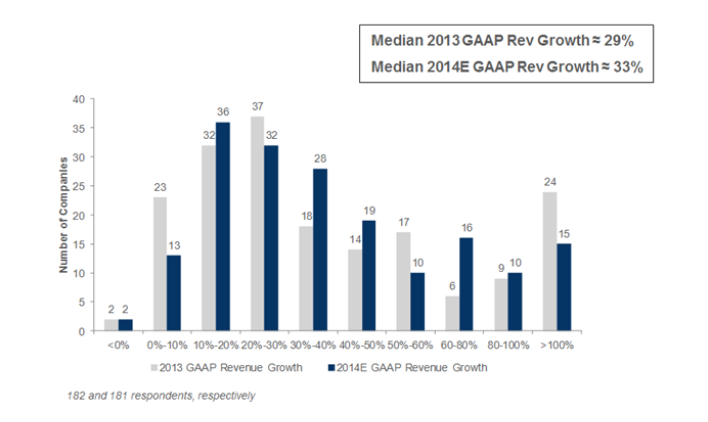
A high concentration of participants with >100% growth comes from the large number of small companies. Excluding companies with <$2.5MM in revenue, we found a more traditional bell curve distribution, with median 2013 growth at 29% and projected growth for 2014 at 33%. These rates were still below last year’s survey results of 32% and 36% for 2012 historical growth and 2013 estimated growth.
Median Growth Rate as a function of Size of Company
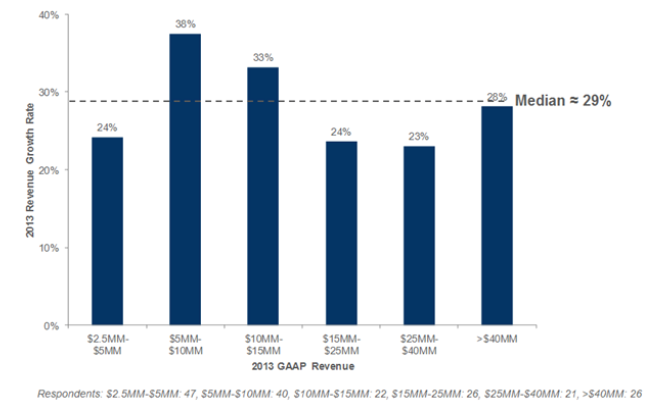
While less pronounced this year, companies ranging from $5MM – $15MM experienced the highest growth. This excludes companies with <$2.5MM in revenue.
Median Growth Rate as a function of Sales Strategy
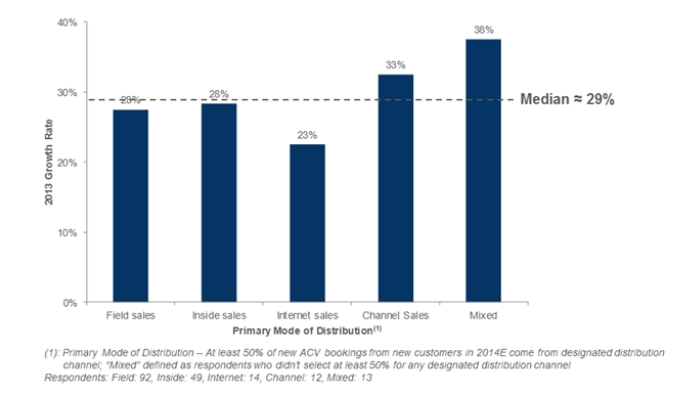
When removing the smallest companies from the distribution, we find growth rates for companies using mainly Internet distribution lagged. Companies with mixed distribution strategies appear to be more agile and reported the highest growth. There was no distinguishable difference between growth rates for field sales vs. inside sales dominated companies. Rates are largely in line with last year’s survey. This excludes companies with <$2.5MM in revenue.
Median Growth Rate as a function of Target Customer (1)
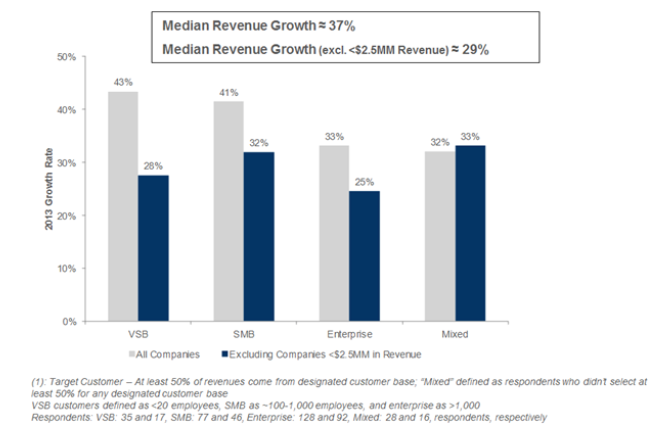
Companies focused on enterprise customers experienced somewhat lower growth rates. However, most, if not all, of the difference can be attributed to the fact that these respondents tend to be larger. VSB-focused vendors remain the fastest growers, but their advantage was significantly greater in the 2013. Meanwhile, enterprise-focused vendors have lost ground (from 38% last year to 33% this year).
Go-to-Market – Primary Mode of Distribution
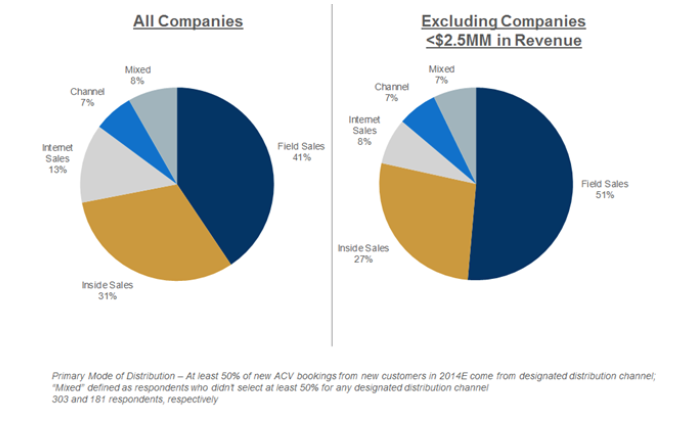
Field sales remains the most popular way to sell, with 41% of participants employing it as their primary mode of distribution (51% if we exclude companies with <$2.5MM in revenues). Inside sales is 10% points behind at 31% (27% if we exclude the smallest companies). Results were nearly identical to last year.
CAC(1): How Much Do You Spend for $1 of New ACV from a New Customer?
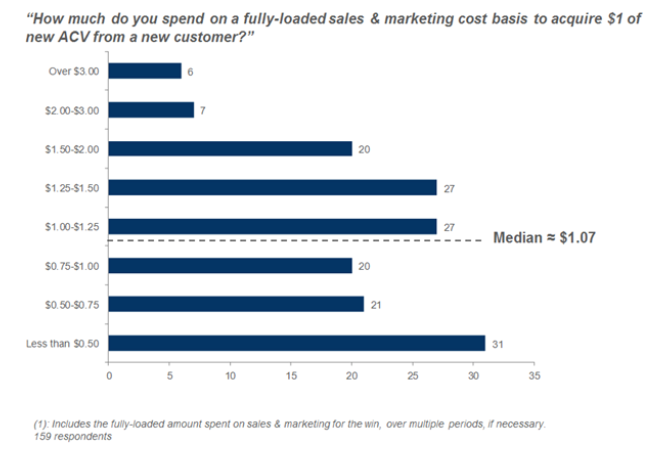
Respondents, excluding the smallest companies, spent a median of $1.07 to acquire each dollar of new ACV from a new customer. This drops to $0.90 if we include the companies <$2.5MM in revenues. This result excluding the smallest companies is noticeably higher than the $0.92 and $0.90 we derived in the 2013 and 2012 surveys respectively. (With pressure on growth rates, it’s possible that companies are spending more to stay competitive. In the cost section to come later we see higher sales and marketing spend, particularly for the larger companies whose growth increased.)
CAC Spend by Primary Mode of Distribution
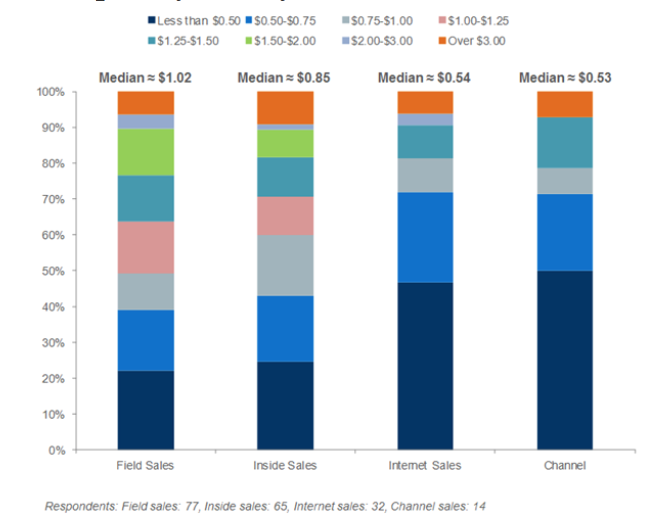
As expected, field sales has the most expensive CAC. And, fields sales has widened the gap as it’s cost has increased, while inside and internet sales have remained relatively flat. Inside sales is now 17% lower than field sales (vs 10% lower last year) and Internet sales is 47% lower (vs 43% lower last year.) Channels sales at $0.53 CAC are at par with online distribution. (For readers interested in digging deeper into how CAC changes as the method of selling goes from touchless Internet sales to inside sales to field sales, you may enjoy this post: “How sales compexity impacts startup viability“.)
Subscription Gross Margins: “What is your gross profit margin on just subscription/SaaS revenues?”
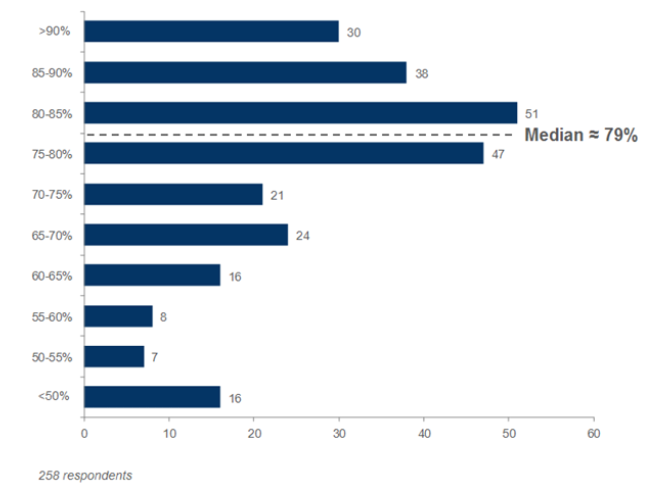
Median subscription gross margins are 79% for the group (78% when removing the smallest companies from the group), which are very similar to 2013 and 2012 results.
Freemium vs. “Try Before You Buy”
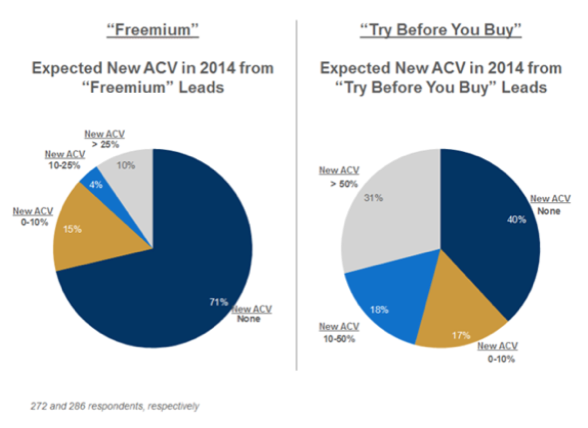
Approximately 30% of companies derive some amount of new ACV from “freemium” strategies, though it’s very rare that a company drives their business on it. The “Try Before You Buy” strategy is much more common: 60% of companies derive revenues through this strategy, and one-third derive the majority of their new ACV through “Try Before You Buy”. These findings are very consistent with results from previous years.
Sales Commissions
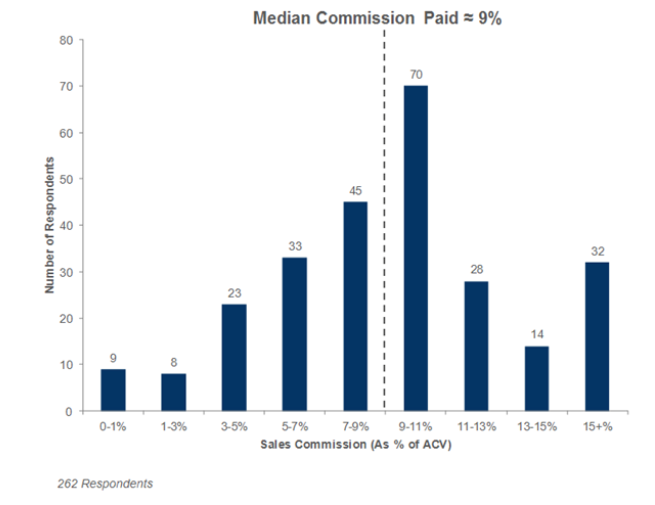
The median reported sales commission rate for the group is 9% of ACV.
Commissions for Renewals, Upsells and Multi-Year Deals
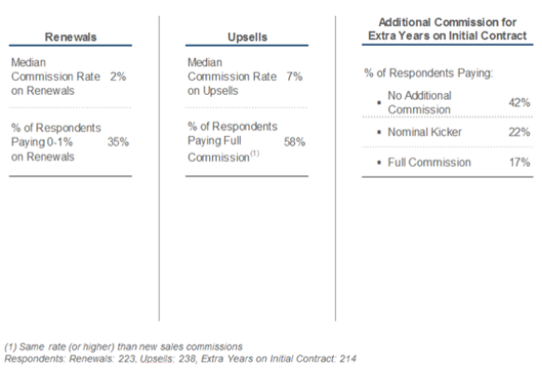
Not surprisingly, commissions on renewals are typically deeply discounted, with a median rate of 2%. Upsells command a median rate of 7%, although more than half of the companies pay full commissions on upsells. Similar results were found last year. The biggest change is in the analyzing commissions on multi-year deals, found above in the third column. In the 2013 survey, only 24% of respondents paid no additional commissions on the additional years; this year, similar to 2012 results, that number was notably higher at 42%.
Effect of Renewal Commission Rates on Churn
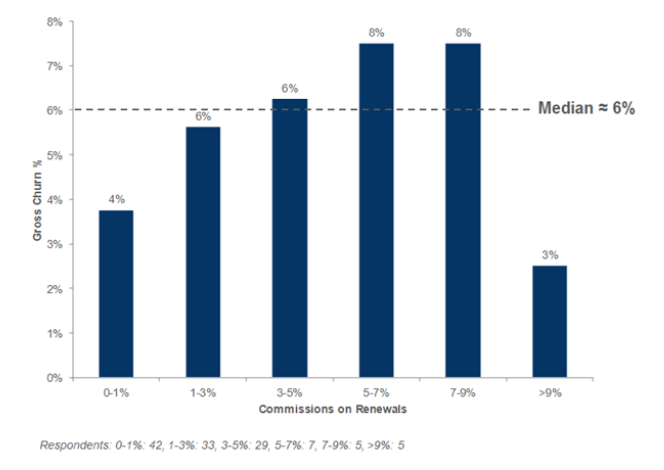
One natural question to ask is whether companies who pay higher commissions on renewals experience lower churn. The answer is a qualified “yes”, at the very high end of renewal commission rates (>9%). However, churn rates among the lowest payers (and companies who don’t pay any commissions at all on renewals), are lower than churn rates for middle-of-the-pack payers. This also excludes companies with <$2.5MM in revenue.